Business Address
Office 5737 58 Peregrine Road Hainault Ilford Essex IG63SZ UK

Business Address
Office 5737 58 Peregrine Road Hainault Ilford Essex IG63SZ UK

Contents
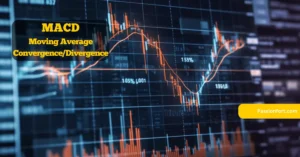
The MACD (Moving Average Convergence/Divergence) is a popular technical analysis tool used by traders to identify potential trend reversals, momentum shifts, and buy/sell signals in financial markets, including cryptocurrency markets. Developed by Gerald Appel in the late 1970s, MACD is based on the comparison of two exponential moving averages (EMAs) of different lengths. By subtracting the longer-term EMA from the shorter-term EMA, MACD generates a single line known as the MACD line, which oscillates above and below a zero line. Traders often use MACD crossovers, signal line crossovers, and divergence to make informed trading decisions.
Moving Average Convergence/Divergence plays a crucial role in technical analysis due to its ability to provide valuable insights into market trends and momentum. Unlike simple moving averages, which only consider past price data, MACD incorporates both price and momentum factors, making it a versatile indicator for traders of all experience levels. Whether used alone or in conjunction with other technical indicators, MACD helps traders identify potential entry and exit points, confirm trend strength, and filter out noise from market fluctuations. Its popularity among traders in various financial markets, including cryptocurrency trading, underscores its significance in technical analysis. Throughout this article, we will explore the components of MACD, its calculation method, and practical strategies for using MACD in crypto trading scenarios.
Recommended: What Are Moving Averages? How to Use Moving Averages for Crypto Trading
MACD (Moving Average Convergence/Divergence) isn’t a magic crystal ball that predicts the future of crypto prices. Instead, it’s a momentum oscillator that helps traders gauge the strength and direction of a prevailing trend. It accomplishes this by utilizing two exponential moving averages (EMAs) – a fancy way of calculating the average price over a specific period but giving more weight to recent prices.
The MACD (Moving Average Convergence/Divergence) indicator itself is represented by a line derived by subtracting the 26-period EMA from the 12-period EMA. Imagine it as a tug-of-war between these two averages. When the 12-period EMA (representing the shorter timeframe) is higher than the 26-period EMA (representing the longer timeframe), the MACD line moves above zero, potentially indicating bullish momentum. Conversely, when the 26-period EMA overpowers the 12-period EMA, the MACD line dips below zero, suggesting a possible downtrend.
Recommended: Bollinger Bands Strategies: A Comprehensive Guide for Traders and Investors
Now that we understand the core concept of MACD (Moving Average Convergence/Divergence), let’s dissect its different parts to gain a clearer picture of how it functions. Moving Average Convergence/Divergence boasts three key components that work together to provide valuable insights:
By understanding these three components and how they interact, you can begin to interpret the signals generated by MACD (Moving Average Convergence/Divergence) and make informed decisions about your crypto trading strategy.
Recommended: Trend Lines: How to Draw and Use Them for Crypto Trading
Moving Average Convergence/Divergence provides a wealth of information through its various components, but the key lies in understanding the messages these components convey. Here’s a breakdown of some crucial MACD (Moving Average Convergence/Divergence) signals and how they can be interpreted:
It’s important to remember that these signals are not absolute guarantees. MACD (Moving Average Convergence/Divergence) can generate false signals, especially in volatile markets. Therefore, it’s crucial to use these signals in conjunction with other technical indicators and consider overall market conditions before making trading decisions.
While Moving Average Convergence/Divergence is a powerful tool, it’s not a one-size-fits-all solution. The cryptocurrency market is complex, and relying solely on a single indicator can be risky. To strengthen your trading strategy, consider incorporating MACD (Moving Average Convergence/Divergence) alongside other technical indicators:
By combining MACD with complementary indicators, you can build a more well-rounded perspective on the market and make more informed trading decisions. The next section will delve deeper into the practical applications of MACD (Moving Average Convergence/Divergence) in crypto trading strategies.
Recommended: Relative Strength Index (RSI) Indicator for Crypto Trading | A Comprehensive Guide
Now that we’ve unpacked the components and signals of MACD, let’s explore how you can leverage this knowledge to inform your crypto trading strategy. Here are some key applications of MACD:
Remember, these are just some general applications. Always consider other technical indicators, market sentiment, and risk management strategies before making any trading decisions.
While past performance isn’t necessarily indicative of future results, examining real-world examples can shed light on how Moving Average Convergence/Divergence is applied in crypto trading. Here are two brief scenarios:
Scenario 1: Bullish Crossover and Trend Confirmation (Success)
Imagine Bitcoin (BTC) is experiencing a downtrend. The MACD line dips below the zero line, and the histogram contracts, suggesting weak momentum. However, a price reversal is signaled when the MACD line crosses above the signal line (bullish crossover) and the histogram starts to expand. This, along with a rise in price, might encourage a trader to enter a long position (buying BTC) with the expectation of a continued uptrend.
Scenario 2: Bearish Divergence and Missed Signal (Limitation)
In another instance, Ethereum (ETH) might be in an uptrend, reflected by a rising MACD line above zero and an expanding histogram. However, the price starts to form lower highs, while the MACD indicator creates higher highs (bearish divergence). This inconsistency can be a warning sign of a potential trend reversal. If the trader solely relies on the prevailing uptrend in Moving Average Convergence/Divergence and overlooks the divergence, they might miss an opportunity to exit their position before a price decline.
These examples showcase the potential benefits and limitations of using MACD.
Understanding the strengths and weaknesses of any tool is crucial. Here are some common misconceptions about MACD (Moving Average Convergence/Divergence) to avoid:
By recognizing these misconceptions, you can utilize MACD effectively as part of your comprehensive crypto trading strategy.
Q. Is MACD bullish or bearish?
A. MACD itself isn’t inherently bullish or bearish. It’s an indicator that generates signals based on the relationship between moving averages. These signals can suggest potential trends, but it’s crucial to interpret them within the context of the overall market.
Q. How is the MACD line calculated?
A. The MACD line is calculated by subtracting the 26-period EMA from the 12-period EMA. This essentially shows the difference between the shorter-term and longer-term average price movements.
Q. Can MACD be used for day trading crypto?
A. Yes, MACD can be used for day trading by focusing on shorter-term signals like crossovers and divergences. However, due to the fast-paced nature of day trading, it’s even more important to combine MACD with other indicators and employ strict risk management strategies.
Q. What are the limitations of MACD?
A. MACD can generate false signals, especially in volatile markets. Additionally, it doesn’t account for fundamental factors that can influence price movements.
Q. Where can I learn more about MACD?
A. There are numerous online resources available that delve deeper into technical analysis and MACD usage. Consider reputable financial websites, online trading platforms’ educational materials, and books on technical analysis for cryptocurrencies.
This blog post has equipped you with a foundational understanding of MACD (Moving Average Convergence/Divergence) and its application in crypto trading strategies. Remember, successful crypto trading requires a combination of technical analysis tools, risk management strategies, and a healthy dose of caution. Use MACD as a guide, not a guarantee, and conduct further research to refine your trading skills. By continuously learning and adapting, you can navigate the dynamic world of cryptocurrency with greater confidence.