Business Address
Office 5737 58 Peregrine Road Hainault Ilford Essex IG63SZ UK

Business Address
Office 5737 58 Peregrine Road Hainault Ilford Essex IG63SZ UK

Contents
The fast-paced world of crypto day trading demands quick decisions based on real-time market movements. To navigate this dynamic environment, traders rely on a variety of technical analysis tools to identify potential opportunities. Among these tools, trend lines stand out as a valuable technique for visualizing price direction and making informed trading decisions.
By understanding how to draw and use trend lines effectively, crypto day traders can gain a significant advantage. Trend lines help identify short-term trends and predict potential price movements, allowing traders to capitalize on profitable opportunities. This article will delve into the world of trend lines, explaining how to draw them, utilize them for strategic trading decisions, and navigate their limitations within the crypto market.
Recommended: What is Crypto Day Trading? A Comprehensive Guide for Beginners
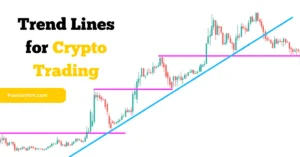
Imagine a line connecting a series of mountain peaks on a graph. In the world of crypto charts, trend lines serve a similar purpose. They are essentially straight lines drawn on a price chart that connect swing highs (peaks) in an uptrend or swing lows (valleys) in a downtrend. These lines visually represent the overall direction of the price movement, helping traders identify potential support and resistance levels.
There are three main types of trend lines you’ll encounter in crypto trading:
A reliable charting platform is essential for crypto day trading, and most platforms offer tools for easily drawing trend lines on your charts. Having a clear visual representation of the trend lines allows you to analyze price movements and make informed trading decisions.
Recommended: Crypto Day Trading Strategies for Beginners: Your Ultimate Guide
Now that you understand the concept of trend lines, let’s delve into the practical steps of drawing them effectively for crypto day trading. Here’s a breakdown of the process:
Identifying Swing Points:
The foundation of any trend line lies in identifying swing points on your crypto chart. These are the high and low points in price that create the peaks and valleys.
Connecting the Dots:
Once you’ve identified your swing points, it’s time to connect them with a trend line. Here are some key points to remember:
Different Timeframes:
The timeframe you choose for your chart (e.g., hourly, daily, weekly) can affect the appearance and strength of your trend lines. Shorter timeframes tend to show more volatile price movements, resulting in “choppier” trend lines. Conversely, longer timeframes tend to smooth out the price action, creating cleaner and potentially more reliable trend lines.
As a beginner, it’s recommended to start with higher timeframes (daily or above) to get a feel for the overall trend direction before venturing into shorter timeframes for more granular analysis.
Recommended: What Are Moving Averages? How to Use Moving Averages for Crypto Trading
Now that you can confidently draw trend lines, let’s explore how to leverage them for formulating crypto day trading strategies. Here are two key ways trend lines can be used:
Identifying Support and Resistance:
Trend lines often act as support (uptrend line) or resistance (downtrend line) levels for the price. Imagine a bouncy ball – support acts like the floor, preventing the price from falling too low (uptrend), while resistance acts like the ceiling, hindering the price from rising too high (downtrend).
Price movements often test these support and resistance zones. If the price bounces off the trend line after touching it, it can be a sign that the trend is still holding. Conversely, a price break through the trend line (upwards for uptrend, downwards for downtrend) can signal a potential trend reversal.
Entry and Exit Signals:
While breakouts above a resistance line (uptrend) or below a support line (downtrend) can be initial signals of a trend continuation, it’s crucial to exercise caution. False breakouts can occur, caused by temporary market volatility.
To improve the reliability of your entry and exit signals, consider combining trend lines with other technical analysis tools like price action confirmation (e.g., candlestick patterns). For example, a bullish candlestick pattern appearing after a breakout above a resistance line in an uptrend can strengthen the entry signal.
Remember, trend lines are not guarantees. Always practice good risk management by setting stop-loss orders to limit potential losses, even when using trend lines in your trading strategy.
It’s important to remember that trend lines are valuable tools, but not foolproof indicators. Here are some limitations to consider:
To mitigate these limitations, consider:
Q: Are trend lines effective for all cryptocurrencies?
A: Trend lines can be helpful for analyzing any cryptocurrency, but their effectiveness can vary depending on the specific coin’s volatility and market conditions. Highly volatile cryptocurrencies might exhibit more “choppy” price action, making trend line less clear-cut.
Q: How many times can I touch the trend line before it’s considered broken?
A: There’s no strict rule, but generally one or two minor touches are acceptable. Multiple touches or a significant price movement through the line suggests a potential trend break. It’s important to use your judgment and consider the overall price action.
Q: Can I use trend lines alongside other technical indicators?
A: Absolutely! Combining trend lines with other indicators like moving averages or RSI (Relative Strength Index) can provide a more robust trading strategy. Different indicators offer unique insights, and using them together can help you make more informed decisions.
By understanding how to draw and use trend lines effectively, crypto day traders gain a valuable tool for identifying potential trends and making informed trading decisions. Remember, trend lines offer insights into price direction with some limitations. Always practice good risk management and combine them with other technical analysis methods for a more comprehensive approach to crypto day trading.