Business Address
Office 5737 58 Peregrine Road Hainault Ilford Essex IG63SZ UK

Business Address
Office 5737 58 Peregrine Road Hainault Ilford Essex IG63SZ UK

Contents
The world of cryptocurrency can be a thrilling yet intimidating space for new investors. Prices can fluctuate wildly, and emotions often run high. To navigate this dynamic market, many crypto traders rely on technical analysis tools to make informed decisions.
One such tool is the Relative Strength Index (RSI), a popular momentum indicator that can provide valuable insights into potential buying and selling opportunities. This comprehensive guide will delve into everything you need to know about the RSI indicator in the context of crypto trading. We’ll explore how Relative Strength Index RSI works, how to interpret its signals, and how to integrate it effectively into your crypto trading strategy. By the end of this blog post, you’ll be well-equipped to leverage the power of RSI and gain an edge in the ever-evolving cryptocurrency market.
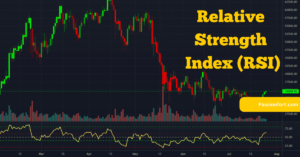
The Relative Strength Index (RSI) is a technical analysis indicator that measures the recent price changes of an asset to gauge its momentum. In simpler terms, RSI reflects how quickly and significantly a crypto’s price has moved over a specific timeframe.
The Relative Strength Index calculation considers the average gains and average losses of a cryptocurrency within that timeframe. By comparing these averages, the indicator generates a score between 0 and 100. This score provides traders with a relative view of the asset’s price strength, helping them identify potential overbought or oversold conditions.
The RSI score plays a crucial role in understanding potential buying and selling opportunities in the crypto market. Traditionally, Relative Strength Index is interpreted based on the following zones:
However, it’s important to remember that these zones are general guidelines and not absolute rules. The Relative Strength Index should be interpreted within the context of the broader market trend and other technical indicators.
For instance, an RSI reading of 75 during a strong uptrend might not necessarily signal an immediate price reversal. Similarly, an RSI of 25 in a downtrend might not guarantee a swift price hike.
Recommended: Trend Lines: How to Draw and Use Them for Crypto Trading
The Relative Strength Index indicator offers several advantages for crypto traders seeking to navigate the volatile market:
By incorporating relative strength index into your trading strategy, you gain valuable insights into the momentum behind a cryptocurrency’s price movement, potentially leading to more informed trading decisions. However, it’s crucial to understand that RSI has limitations, and using it effectively requires a multi-faceted approach.
Recommended: What Are Moving Averages? How to Use Moving Averages for Crypto Trading
While the basic interpretation of RSI zones provides valuable insights, delving deeper into some advanced concepts can further enhance your understanding:
Including divergence analysis alongside Relative Strength Index zones can provide a more comprehensive view of potential turning points in the market.
By understanding these advanced RSI concepts, you can unlock a deeper level of analysis and potentially make more informed trading decisions. However, it’s vital to remember that Relative Strength Index is just one tool in your technical analysis toolbox. We’ll discuss its limitations and how to use it effectively in your strategy in the following sections.
Recommended: Crypto Day Trading Strategies for Beginners: Your Ultimate Guide
The RSI indicator, while valuable, has limitations that every crypto trader should be aware of:
To avoid misinterpretations, it’s essential to:
By understanding these limitations and employing a multi-faceted approach, you can minimize the risk of misinterpretations and leverage RSI more effectively in your crypto trading strategy.
Now that you understand the core concepts and limitations of RSI, let’s explore how to integrate it effectively into your crypto trading strategy:
Remember: These are just basic examples. Always prioritize risk management and adapt your strategies based on market conditions and your risk tolerance.
By following these steps and practicing consistently, you can gain valuable experience in using RSI effectively within your overall crypto trading strategy.
1. What is a good RSI score for buying crypto?
There’s no single “good” RSI score for buying crypto. The traditional interpretation suggestsを狙う (nerau – to aim for) an entry around 30 (oversold) and an exiting around 70 (overbought). However, these zones are guidelines.
A better approach is to look for Relative Strength Index readings alongside confirmatory signals from other indicators and consider the broader market trend. For example, an RSI of 30 during a strong downtrend might not necessarily signal a good buying opportunity.
2. Can RSI be used on stocks as well?
Absolutely! RSI is a versatile tool applicable to various assets, including stocks, commodities, and even forex. The core principles of interpretation remain the same across different markets.
3. Does a high RSI always mean a price drop?
No, a high RSI doesn’t guarantee an immediate price drop. It simply indicates overbought territory, suggesting a potential correction. However, market forces and other factors can influence price movements.
4. What other indicators should I use with Relative Strength Index?
The Relative Strength Index is most effective when combined with other technical indicators. Some common pairings include:
5. How can I practice using RSI before trading with real money?
Many platforms offer paper trading accounts or demo accounts that allow you to simulate real-world trading without risking actual capital. This is a fantastic way to experiment with RSI and develop your trading strategies in a safe environment.
The Relative Strength Index (RSI) can be a valuable tool for crypto traders seeking to identify potential entry and exit points. However, remember that RSI is just one piece of the puzzle. By understanding its limitations and using it alongside other technical indicators and fundamental analysis, you can gain a more comprehensive understanding of the market and potentially make informed trading decisions.