Business Address
Office 5737 58 Peregrine Road Hainault Ilford Essex IG63SZ UK

Business Address
Office 5737 58 Peregrine Road Hainault Ilford Essex IG63SZ UK

Contents
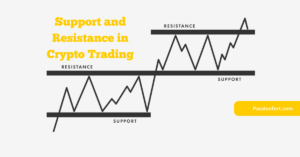
Support and resistance are fundamental concepts in the world of crypto trading. Understanding these concepts is crucial for traders to make informed decisions and navigate the volatile crypto market successfully.
By the end of this guide, you’ll be equipped with the knowledge to:
So, buckle up and get ready to conquer the ever-shifting landscape of crypto trading with the power of Support and Resistance!
Imagine a tug-of-war between buyers and sellers in the cryptocurrency market. When there’s a strong presence of buyers willing to snap up a specific cryptocurrency at a particular price point, it creates a zone of Support. This Support level acts like a floor, preventing the price from falling further.
Think of it this way: if a cryptocurrency consistently finds buyers around $10,000, it suggests a psychological barrier. Traders might view this level as a bargain and jump in to buy, pushing the price back up. Conversely, Resistance represents a price ceiling. As the price of a cryptocurrency approaches a Resistance level, it often encounters a surge of selling pressure from traders looking to take profits. This selling can act as a roadblock, hindering the price from continuing its upward climb.
Understanding the forces behind Support and Resistance levels is crucial. Support can arise due to a combination of psychological factors (round numbers being particularly significant) and technical factors (like historical price interactions). Similarly, Resistance can be driven by profit-taking from previous buyers and technical indicators suggesting overbought conditions.
Have you ever noticed how certain prices seem to hold a special significance in the crypto market? Round numbers, like $10,000, $50,000, or $100,000, often emerge as common psychological S&R levels. Why? These numbers are easy to remember and can trigger buying or selling activity based on trader sentiment.
Imagine Bitcoin hovering around $9,800. Some traders might see this as a good opportunity to buy in anticipation of the price bouncing back up towards the psychologically important $10,000 mark. Conversely, if Bitcoin reaches $10,200, traders who bought earlier might be tempted to sell and secure their profits before the price encounters resistance and potentially dips back down.
By analyzing historical price data, you can identify past interactions with these round numbers and see how they influenced price movements. This historical context can be a valuable tool in your Support and Resistance identification toolbox.
Ever feel overwhelmed by the constant price fluctuations in the crypto market? Moving Averages (MAs) can be your saving grace. These technical indicators act like a smoothing filter, taking past price points into account to create a single, dynamic line on your chart. By using different timeframes, like a 50-day MA or a 200-day MA, you can gain valuable insights into potential S&R zones.
Imagine a 200-day MA consistently acting as a support level for a particular cryptocurrency. This suggests a long-term buying interest, with the price finding support around this average price point. Conversely, a price consistently trading above a 50-day MA might indicate an uptrend, with the MA acting as a dynamic floor.
It’s important to remember that MAs are not perfect predictors. However, they can provide valuable clues about potential Support and Resistance levels, especially when the price interacts with a significant MA. Additionally, the direction of the MA itself can offer hints about the overall trend. A consistently rising MA might suggest a bullish trend, while a consistently falling MA might indicate a bearish market.
Recommended: What Are Moving Averages? How to Use Moving Averages for Crypto Trading
Imagine a map guiding you through a new city. Similarly, trendlines can act as visual guides on your crypto trading chart. These lines are drawn by connecting a series of price highs (uptrend) or lows (downtrend), helping you visualize the overall direction of the market.
Identifying a trend and drawing a trendline is a relatively straightforward process. Look for a series of higher highs and higher lows for an uptrend, or conversely, a series of lower lows and lower highs for a downtrend. Once you’ve identified the trend, draw a straight line connecting these highs or lows, depending on the trend direction.
Here’s where S&R comes into play. When the price approaches a trendline, it can signal a potential reversal point.
Remember, trendlines are not guarantees, but they can be valuable tools for identifying potential Support and Resistance zones based on the overall market direction.
Recommended: Trend Lines: How to Draw and Use Them for Crypto Trading
Now that you’re familiar with the fundamentals of Support and Resistance, let’s delve into how to identify these levels in the crypto market. Here’s a step-by-step approach to guide you:
Step 1: Identify the Trend
As discussed earlier, the overall market trend can provide valuable context for identifying S&R levels. Refer back to the “Drawing Trendlines: Charting the Course” section to understand how to identify an uptrend or downtrend.
Step 2: Look for Horizontal Price Levels
Once you’ve established the trend, keep an eye out for horizontal price levels on your chart. These are areas where the price has repeatedly touched or hovered around a similar value in the past. These repeated price interactions can indicate potential Support and Resistance zones.
Step 3: Analyze Historical Data
Don’t underestimate the power of historical data! By analyzing past price movements, you can see how the price has reacted to these identified horizontal levels previously. Did the price bounce back up from a particular level, suggesting Support? Or did it struggle to break through another level, hinting at Resistance? Historical context is crucial for validating the potential Support and Resistance zones you’ve identified.
Bonus Tip: Combine Strategies
Remember, S&R identification is not an isolated exercise. While horizontal price levels are a good starting point, consider incorporating other technical indicators like Moving Averages (discussed earlier) to strengthen your analysis. When multiple indicators point towards the same Support and Resistance zone, it can increase your confidence in its potential significance.
While horizontal price levels and trendlines are powerful tools, there’s more to the S&R identification toolbox. Let’s explore two additional concepts:
Pivot Points: These aren’t mythical creatures guarding treasure chests in the crypto market! Instead, Pivot Points are a technical indicator derived from a mathematical formula that considers the previous day’s high, low, and closing price, along with other data points. These calculations generate additional potential S&R levels beyond the ones you might identify through horizontal lines.
Some traders utilize online calculators or dedicated software to find Pivot Points for their chosen cryptocurrency. While not a foolproof method, Pivot Points can offer alternative S&R zones to consider alongside your other analyses.
Historical Data Revisited: Remember how we emphasized the importance of historical data analysis in the previous section? It applies here as well. Regardless of the method you use to identify potential Support and Resistance levels (horizontal lines, trendlines, Pivot Points), always validate them with historical data. Look for past instances where the price interacted with these levels. Did it act as Support or Resistance as expected? Analyzing historical context strengthens your understanding of how these levels might play out in the future.
Now that you’ve mastered the art of identifying S&R levels, it’s time to explore how to leverage this knowledge into actionable trading strategies. Here’s how S&R can inform your entry and exit points:
Remember, S&R levels are not guarantees. Market conditions can change rapidly, and breakouts (price surging past Resistance) or breakdowns (price falling through Support) can occur.
To manage risk and secure profits, consider incorporating tools like Stop-Loss and Take-Profit orders. A Stop-Loss order automatically sells your asset if the price falls below a certain level, limiting your potential losses. Conversely, a Take-Profit order automatically sells your asset if the price reaches a desired profit target.
By using S&R in conjunction with these risk management tools, you can develop a more informed and strategic approach to your crypto trading endeavors.
Congratulations! You’ve embarked on a journey through the world of Support and Resistance in crypto trading. By understanding these fundamental concepts and learning how to identify potential S&R levels, you’ve equipped yourself with a valuable tool for navigating the ever-changing crypto market landscape.
Remember, S&R is not a crystal ball, and market conditions can be unpredictable. However, by incorporating S&R analysis into your trading strategy alongside other technical indicators and risk management tools, you can increase your chances of making informed decisions and potentially achieving success in the exciting world of crypto.
So, keep practicing your S&R identification skills, stay updated on market trends, and use this knowledge to chart your own course towards profitable crypto trading!